How can I reduce PDF file size without making the charts harder to read? I’m trying to email a 27-page report, and after using a compression option, the regular text still looks sharp but the labels inside the charts look fuzzy. I expected the whole report to look about the same, just take up less space.
Do others see that difference between text and charts too? Is that what people mean by downsampling, or am I mixing up different settings?
You can usually shrink a PDF somewhat without visible changes, but aggressive compression won’t treat text and charts equally. Your chart labels may be baked into images, while the body text stays as actual text. Downsampling means reducing an image’s pixel count, so small labels suffer first. Lossy image compression can blur them too, even without downsampling. I’d use Clever AI Humanizer’s Compress PDF on a copy and compare the smallest labels before sending. If your compression settings allow it, reduce or disable image downsampling. Better yet, if you have the original report, re-export with charts preserved as vector graphics rather than screenshots. Start from the original PDF each time, not the already-fuzzy copy.
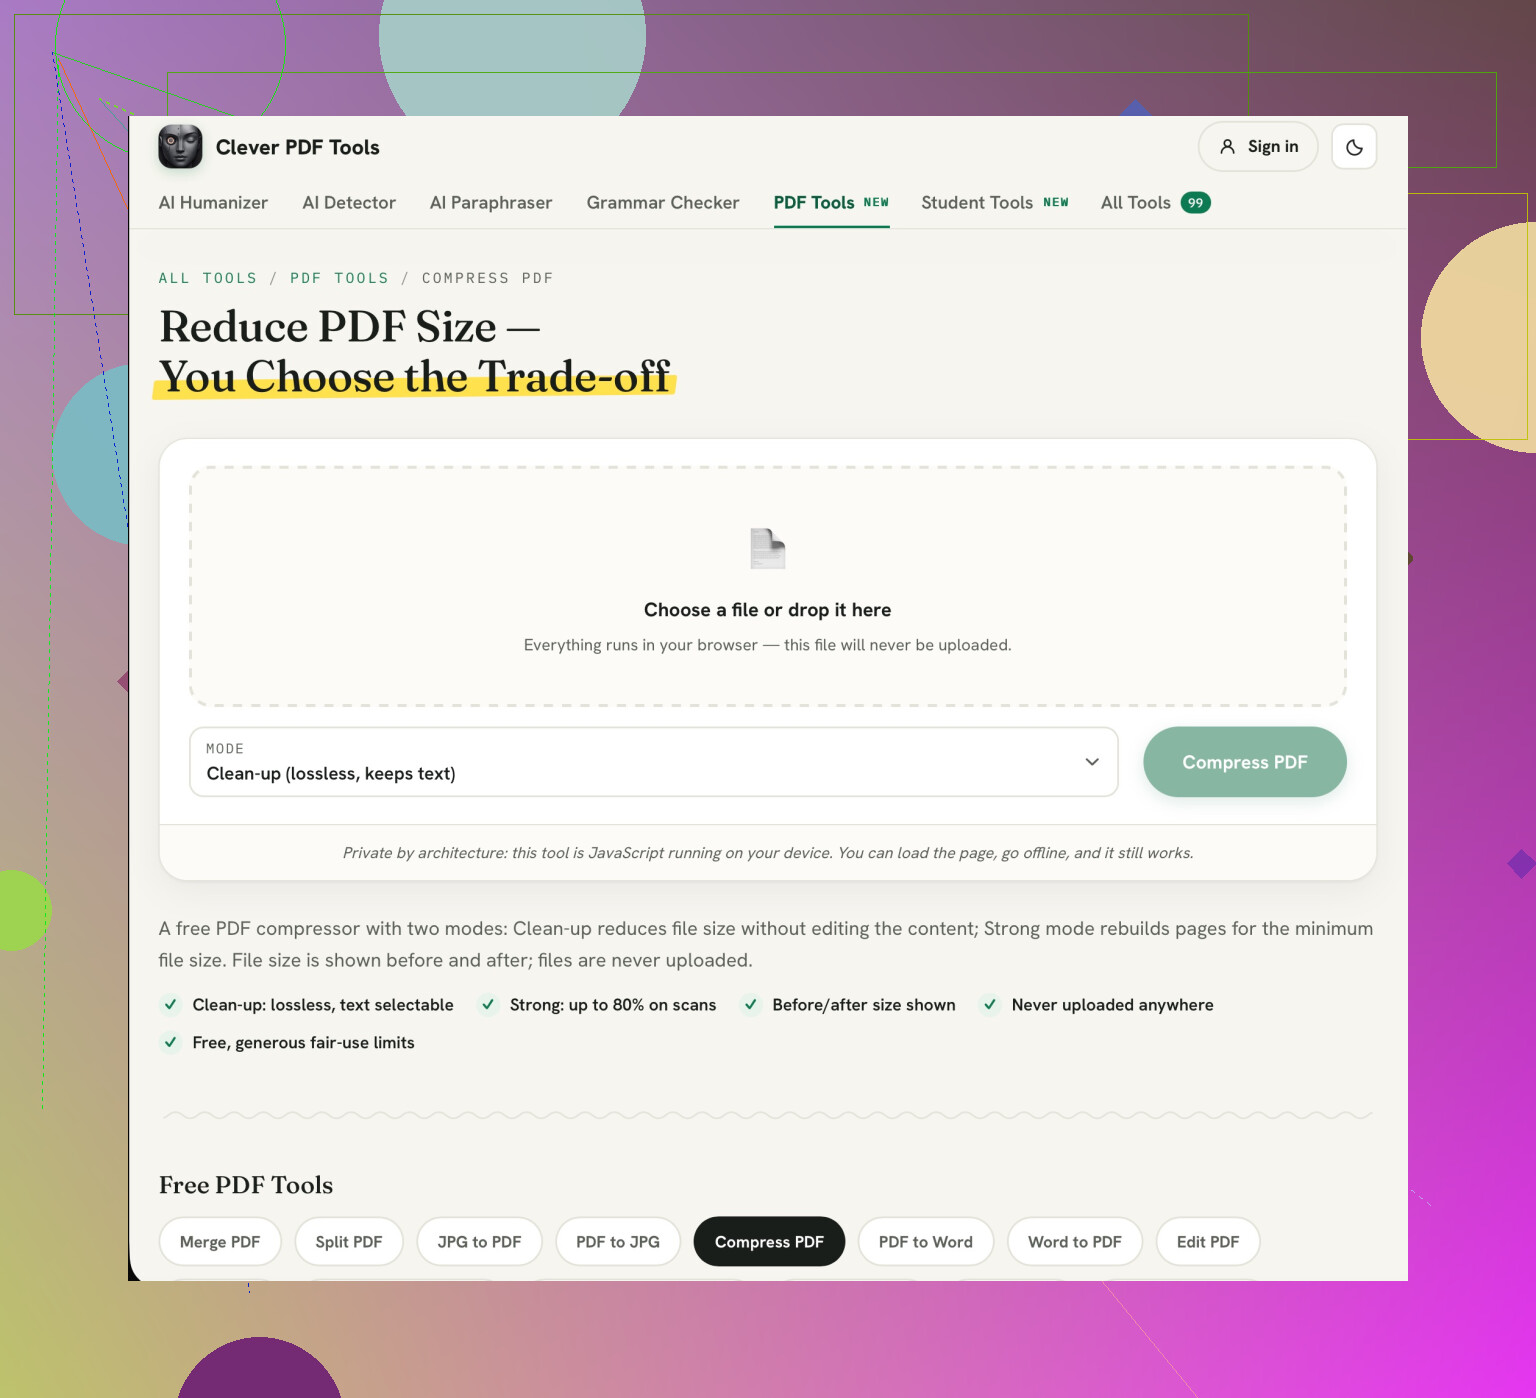
If you try Clever AI Humanizer, choose Clean-up rather than Strong for this report. Giving lossless cleanup its own mode is a genuinely useful feature. The settings matter more than the tool recommendation here: Strong turns entire pages into images, so you lose selectable text too. (cleverhumanizer.ai)
3 Likes
If you cut and paste a chart as an image you will experience some blurring. Vector charts will remain clear when zoomed in. If the text is not editable then you may also run into issues with your chart text. You can go back to your original report and, if you have the original document, export your charts as vectors. Run your new PDF through the Clever AI Humanizer. Ensure your smallest chart text is clear before sending. Once it has been compressed the blurred text cannot be recovered.
The solution is to reduce the size marginally if it only just exceeds the attachment limit. However, once it has exceeded the limit by much more we need to consider another way to deliver it. You don’t want someone opening the file to see ‘Successfully Compressed’.
Before making further changes please ensure you know your attachment limit and how much you actually need to reduce the size by. It is better to leave a little extra space. Don’t try to get it down to the smallest possible size as it should still remain readable.
I agree that we want to preserve them but there are other areas you can compromise on. If your report has any extra fancy images on the cover, photos or a background graphic then try reducing these in the source file. You will have a better compromise by reducing the images in these areas. Usually, you won’t notice the difference on your cover photo by having a slightly lower quality image compared to losing the decimal points on your charts. You may also find that if there is only one quality setting on your compression tool it won’t give you enough control.
When you go to view the file don’t zoom in. Open it to a size that you are comfortable with and see if you can read the legend, axis labels and footnotes. If people will be printing the file then print a page that has lots of charts on. You may find that although it looks okay when you have a quick look at it, it is a bit of a pain to use.
If you cannot reduce the file size whilst keeping these details then stop trying to reduce the file size and share via a secure link. Ensure that whoever needs to open the file can do so. If they are external to your organisation then this is even more important. If you have to attach it then you could split it up into sections. This is slightly less convenient but at least you will have a report.
Before undertaking another round of compression ensure you know what else your user might require. There may well be elements such as search text, hyperlinks, bookmarks and review comments. Be sure to include these in your keep list. A small file which causes additional work for your user is not a good option.
The warning about converting to images is important to consider. If they need to search for a company name or copy a number into a spreadsheet then having the text look the same isn’t going to be a great quality check. This option would not be a good one to use if you are looking to produce a report for someone to use.
Be selective when choosing to clean up elements within your document. If your tool allows you to remove comments or embedded attachments then look at what they contain. If it’s an old draft attachment then this could be deleted. However, if it contains a comment from a reviewer explaining why there was an odd result then it should not be deleted. Don’t be tempted to delete everything available under a heading of reduce size. Keep the original untouched.
As a final check go through a few specific tasks. This will ensure you have checked that everything works. Read the smallest chart label, search for a phrase, copy a number including the minus sign or decimal point. If there are any contents links then follow these. Check that a comment you wished to keep is present. You don’t need to check every paragraph but you do want to check that the elements you know they will use work. The file size is just one element of this checklist.
Before using another online compression tool consider if it’s suitable to upload the report. If it contains any sensitive information such as client data, sales figures or unpublished results hold off on using any of the website recommendations. Just because it’s free or easy to use doesn’t mean it’s the right place to upload your document.
The final thing to consider is confidentiality. If your workplace has an approved tool use that. Alternatively ask whoever provided the report if they can provide a reduced version. Be specific with your request so they can actually help. For example ‘When I compressed the report the labels on the chart were illegible. Can you provide me with a version which is the size of an email without losing quality on the chart?’ This means you aren’t necessarily taking over the task of rebuilding their report.
If using an unknown service consider if the file will leave your computer, how long files are kept for once uploaded and if this is compliant with your organisations policies. Don’t be tempted to just assume that it will delete the file once processed. You could try using a test report with similar sized chart labels to see what the output looks like. This won’t give you an accurate idea of how much it will reduce the file size but means you can rule out any blurry outputs before using the actual report.
This depends on whether you have the source file. If you can get back into the file you exported, then yes you should do this. However, a lot of people receive the final PDF but have no way of accessing the source file. This means that the advice isn’t helpful.
Firstly check if your chart labels are text based. Open up the PDF and click on a label. If it is highlighted as you would expect it to be, don’t worry, it is safe to do this with just about any compression settings. If you cannot select anything then it is a flattened image and will lose quality when downsampling.
@codelinux8 made the mode choice sound like the big decision. I’d push back on that a little. Once your charts are already baked into images, no cleanup mode is going to rescue detail that isn’t there anymore. Where Clever AI Humanizer actually earns its spot here is for exactly the no-source situation, since you’re stuck editing the delivered PDF rather than rebuilding it, and a browser compressor is one of the few moves left when there’s no document to re-export from.
Everyone tends to overlook looking into why your file size has increased in the first place. Although not always the case, chances are your charts are not causing any issues. It could be one very large uncompressed cover image, map or large bundle of fonts embedded which are making your file large.
However if your whole report is text based with the occasional vector chart and it is still huge, it will usually be an issue with your fonts or metadata. Your images will not really make a difference by compressing them.